UK Retail Inflation Data
Retail Economics identifies crucial inflationary indicators which underpin our views on inflationary pressures facing UK households and cost pressures facing retailers.
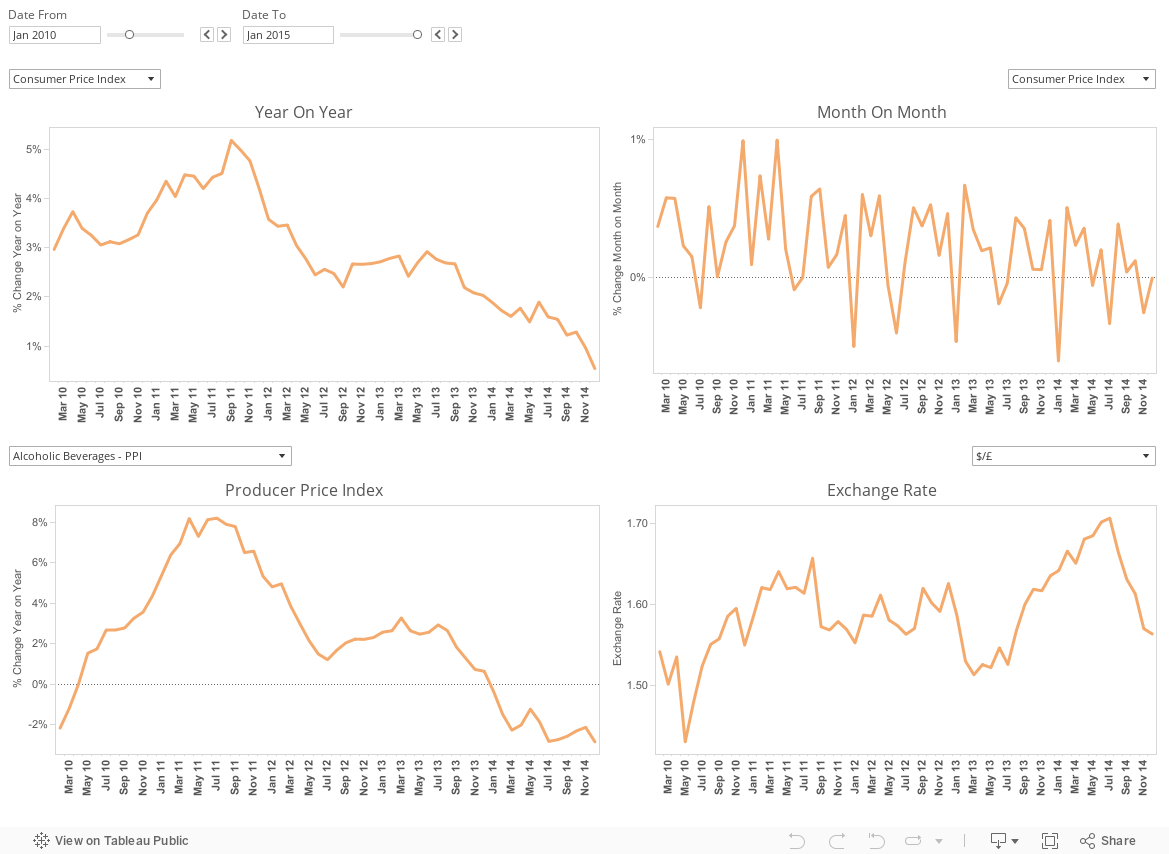
As a subscriber, you can instantly view, download and analyse a range of retail data sources using our data visualisation tools and intuitive dashboard. Includes:
- Retail sales by category: food, clothing, electricals, homewares etc.
- Online retail sales growth
- Access underlying data for graphs and charts in your insight reports
- Downloadable retail sales time series data and more...

Subscribers can click on the download icon ![]() to access a CSV file containing up to ten years' worth of data which can be easily manipulated.
to access a CSV file containing up to ten years' worth of data which can be easily manipulated.
As a subscriber, we can also work with you to provide you with bespoke Excel charting options with the indicators that most suit your business needs.
Non-subscribers can only view and select data up to December 2014. Subscribers can view and select the latest available data, going back up to ten years.
Explore data sets
Headline Inflation Statistics (ONS)
| % change year-on-year | Mar | Apr | May | Jun | Jul | Aug | Source | Download |
|---|---|---|---|---|---|---|---|---|
| ONS Consumer Price Index (CPI) | 2.4 | 2.4 | 2.4 | 2.4 | ONS |
|
||
| ONS Retail Price Index (RPI) | 3.3 | 3.4 | 3.3 | 3.4 | ONS |
|
||
| ONS Retail Price Index (RPIX) | 3.4 | 3.4 | 3.4 | 3.4 | ONS |
|
||
| CPI Core (excluding energy, food) | 2.2 | 2 | 2.1 | 1.8 | ONS |
|
Components of the Consumer Price Index (ONS)
| % change year-on-year | Mar | Apr | May | Jun | Jul | Aug | Source | Download |
|---|---|---|---|---|---|---|---|---|
| Food and Non-Alcoholic Beverages | 3 | 2.6 | 2.3 | 2 | ONS |
|
||
| Alcoholic Beverages and Tobacco | 3.5 | 4 | 4 | 4 | ONS |
|
||
| Clothing and Footwear | 2.5 | 1.8 | 1.5 | 0.4 | ONS |
|
||
| Housing, Water, Electricity, Gas and Other Fuels | 2.2 | 2.1 | 1.5 | 2.2 | ONS |
|
||
| Furniture and Household Equipment | 2.5 | 2.7 | 2.1 | 2 | ONS |
|
||
| Health | 2.8 | 2.8 | 2.4 | 2.5 | ONS |
|
||
| Transport | 3 | 2.5 | 4.7 | 5.5 | ONS |
|
||
| Communication | -0.3 | 1 | 0.7 | 0.7 | ONS |
|
||
| Recreation and Culture | 3.3 | 3.4 | 2.6 | 2.3 | ONS |
|
||
| Education | 2.8 | 2.8 | 2.8 | 2.8 | ONS |
|
||
| Restaurants and Hotels | 2.6 | 2.8 | 2.6 | 2.6 | ONS |
|
||
| Miscellaneous Goods and Services | -0.1 | N/A | N/A | -0.2 | ONS |
|
Producer Price Index (ONS)
| % change year-on-year | Mar | Apr | May | Jun | Jul | Aug | Source | Download |
|---|---|---|---|---|---|---|---|---|
| Producer Price Index Output | 2.5 | 2.5 | 3 | 3.1 | ONS |
|
||
| Producer Price Index Input | 4.4 | 5.5 | 9.6 | 10.2 | ONS |
|
Exchange Rates/Monetary Indicators (Bank of England)
| % change year-on-year | Mar | Apr | May | Jun | Jul | Aug | Source | Download |
|---|---|---|---|---|---|---|---|---|
| Sterling - Trade Weighted Index | 79.2 | 80.3 | 78.8 | 78.5 | Bank of England |
|
||
| Euro/GBP | 1.1 | 1.1 | 1.1 | 1.1 | Bank of England |
|
||
| US Dollar/GBP | 1.4 | 1.4 | 1.4 | 1.3 | Bank of England |
|
||
| Yen/GBP | 146.9 | 149.3 | 149.2 | 146 | Bank of England |
|
||
| Official Bank Rate | 0.5 | 0.5 | 0.5 | 0.5 | Bank of England |
|
||
| 10 Year Gilt Yield | 1.5 | 1.5 | 1.5 | 1.4 | Bank of England |
|