UK Consumer Data
Retail Economics identifies crucial economic indicators which underpin the strength of UK household spending.
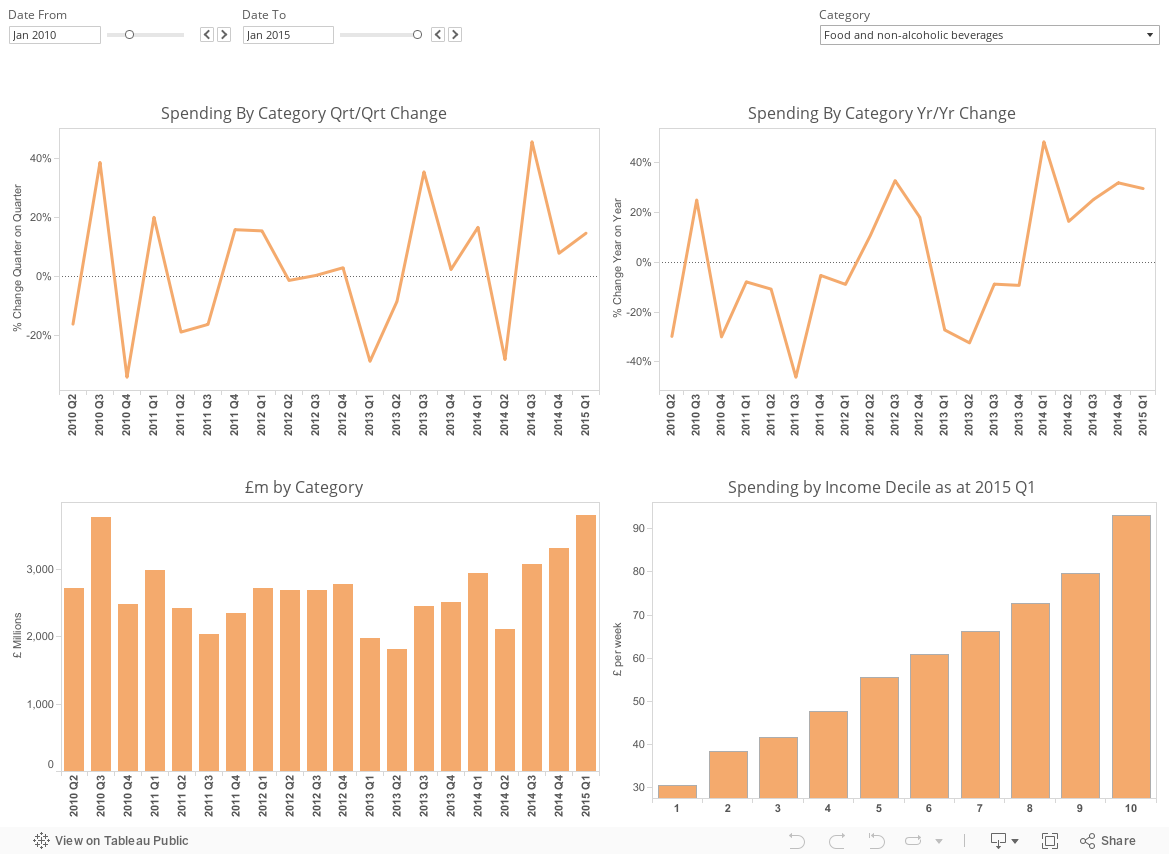
As a subscriber you can instantly view, download and analyse a range of retail data sources using our data visualisation tools and intuitive dashboard. Includes:
- Retail sales by category: food, clothing, electricals, homewares etc.
- Online retail sales growth
- Access underlying data for graphs and charts in your insight reports
- Downloadable retail sales time series data and more...

Subscribers can click on the download icon ![]() to access a CSV file containing up to ten years' worth of data which can be easily manipulated.
to access a CSV file containing up to ten years' worth of data which can be easily manipulated.
As a subscriber, we can also work with you to provide you with bespoke Excel charting options with the indicators that most suit your business needs.
Non-subscribers can only view and select data up to December 2014. Subscribers can view and select the latest available data, going back up to ten years.
Explore data sets
UK Output (ONS)
| % change | Q4 2017 | Q1 2018 | Q2 2018 | Q3 2018 | Source | Download |
|---|---|---|---|---|---|---|
| GDP (% change Q-o-Q) | 0.4 | 0.2 | ONS |
|
||
| GDP (% change Y-o-Y) | 1.1 | 1.8 | ONS |
|
Consumer Spending - year-on-year (ONS)
| % change | Q4 2017 | Q1 2018 | Q2 2018 | Q3 2018 | Source | Download |
|---|---|---|---|---|---|---|
| Consumer Spending y/y | 1.6 | 1.2 | ONS |
|
||
| Household Expenditure - Food and Non-Alcohol y/y | 2.5 | 1.8 | ONS |
|
||
| Household Expenditure - Alcohol and Tobacco y/y | -1.3 | -2.2 | ONS |
|
||
| Household Expenditure - Clothing and Footwear y/y | 1.6 | 0.5 | ONS |
|
||
| Household Expenditure - Housing Costs y/y | 1.7 | 2.3 | ONS |
|
||
| Household Expenditure - Furniture and Household y/y | 4.8 | 5.9 | ONS |
|
||
| Household Expenditure - Health y/y | 5 | 2.9 | ONS |
|
||
| Household Expenditure - Transport y/y | 0.5 | -2 | ONS |
|
||
| Household Expenditure - Communications y/y | 1.5 | 2.1 | ONS |
|
||
| Household Expenditure - Recreation and Culture y/y | 1.9 | 0.2 | ONS |
|
||
| Household Expenditure - Education y/y | -0.8 | -0.8 | ONS |
|
||
| Household Expenditure - Restaurants and Hotels y/y | 1.4 | -0.4 | ONS |
|
||
| Household Expenditure - Miscellaneous y/y | 2.4 | 3.1 | ONS |
|
Consumer Spending - quarter-on-quarter (ONS)
| % change | Q4 2017 | Q1 2018 | Q2 2018 | Q3 2018 | Source | Download |
|---|---|---|---|---|---|---|
| Consumer Spending q/q | 1.1 | 0.9 | ONS |
|
||
| Household Expenditure - Food and Non-Alcohol q/q | 0.2 | 0.4 | ONS |
|
||
| Household Expenditure - Alcohol and Tobacco q/q | -1.2 | -1.5 | ONS |
|
||
| Household Expenditure - Clothing and Footwear q/q | -0.2 | -0.5 | ONS |
|
||
| Household Expenditure - Housing Costs q/q | 0.4 | 0.5 | ONS |
|
||
| Household Expenditure - Furniture and Household q/q | 1.2 | 1.4 | ONS |
|
||
| Household Expenditure - Health q/q | -0.1 | 1.5 | ONS |
|
||
| Household Expenditure - Transport q/q | -0 | -0.3 | ONS |
|
||
| Household Expenditure - Communications q/q | 0.3 | 0.5 | ONS |
|
||
| Household Expenditure - Recreation and Culture q/q | 0.4 | -0.4 | ONS |
|
||
| Household Expenditure - Education q/q | -2 | 0.5 | ONS |
|
||
| Household Expenditure - Restaurants and Hotels q/q | N/A | -1.2 | ONS |
|
||
| Household Expenditure - Miscellaneous q/q | 0.9 | 0.9 | ONS |
|
UK Retail Sales (ONS)
| % change year-on-year | Mar | Apr | May | Jun | Jul | Aug | Source | Download |
|---|---|---|---|---|---|---|---|---|
| ONS Retail Sales Value NSA | 5.2 | 0.6 | 6.4 | 4.4 | ONS |
|
||
| ONS Retail Sales Volume NSA | 3.1 | -1.4 | 4.5 | 3 | ONS |
|
Housing Data (Bank of England)
| % change year-on-year | Mar | Apr | May | Jun | Jul | Aug | Source | Download |
|---|---|---|---|---|---|---|---|---|
| UK mortgage approvals y/y | -7 | -6.1 | -1.8 | -0.2 | Bank of England |
|
||
| UK mortgage approvals m/m | -14.9 | -2 | 36.9 | 18.8 | Bank of England |
|
||
| UK mortgage approvals (thousands) | 63.1 | 63 | 64.7 | 65.6 | Bank of England |
|
Credit and Borrowing (Bank of England)
| % change year-on-year | Mar | Apr | May | Jun | Jul | Aug | Source | Download |
|---|---|---|---|---|---|---|---|---|
| Secured Lending | 3 | 3.1 | 3.2 | 3.4 | Bank of England |
|
||
| Net unsecured borrowing | 8.6 | 8.8 | 8.8 | 8.8 | Bank of England |
|
Household Data (ONS)
| % change | Q4 2017 | Q1 2018 | Q2 2018 | Q3 2018 | Source | Download |
|---|---|---|---|---|---|---|
| Real households' disposable income y/y | 0.5 | 1.9 | ONS |
|
||
| Real households' disposable income q/q | -0.4 | 0.4 | ONS |
|
||
| Interest payments as a percentage of income | 4.2 | 4.1 | ONS |
|
||
| Total debt to income ratio | 140.2 | 138.5 | ONS |
|